The first quarter of 2023 had markets driven most dramatically by US interest rates, their repercussions, and whether the US Federal Reserve would pivot from an interest rate increasing phase to an interest rate decreasing phase.
Bonds and Interest Rates
Bonds continued to be “range-bound” this spring. Basically, central bankers, after their dramatic increase of interest rates of 2022, which pushed bond prices lower, continued this spring their stance from the winter: wait and see. They are waiting and watching to see if the interest rate increases of 2022 were enough to bring inflation back down under control. Since there is a substantial lag of many months from the increase in rates until we see the economy slowing down and until we see inflation coming back to target levels (about 2%/year targets in Canada and the USA), it is a slow process that is far from precise. Think of it like turning the steering wheel on a huge ship and then waiting to eventually see the ship turning.
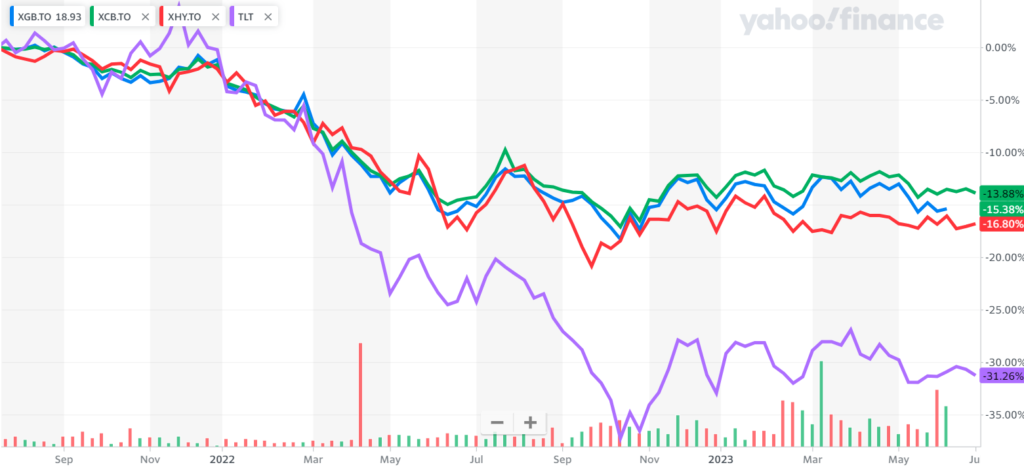
Fig. 1: Bond ETFs: Gov’t: XGB, Corp: XCB, High Yield: XHY, US 20-yr: TLT–2 yr –Yahoo Finance
In June the US Federal Reserve decided to wait another month without any more rate increases to see the extent to which interest rates were having an effect. Meanwhile north of the border the Bank of Canada elected to raise rates in June, seeing an economy that was still clearly withstanding the pressure of the rising rates. This is not the first time the Bank of Canada increased ahead of the Federal Reserve. Back in 2022 the BoC was also faster at accelerating their rates.
Overall, we are starting to see the early results of the interest rate increases. We now see new unemployment claims starting to edge up in the US and we also see fading purchasing manager expectations and fading Chinese factory utilization rates. It turns out the Chinese “post-Covid re-opening” did not amount to much in terms of global economic impact. Hence, while there may be 1-2 more Fed rate increases, central bankers north and south of the border are roughly in the peak restraint mode.
Currencies
This spring the US Dollar continued the winter’s trends highlighted in the April commentary. Although exchange rates bounced around a little, they have been roughly flat since late fall as the dramatic interest rate increases mellowed out. We are now likely at a point where, once the economy slows down, the US dollar will begin to weaken, but before that happens we need to be cautious.
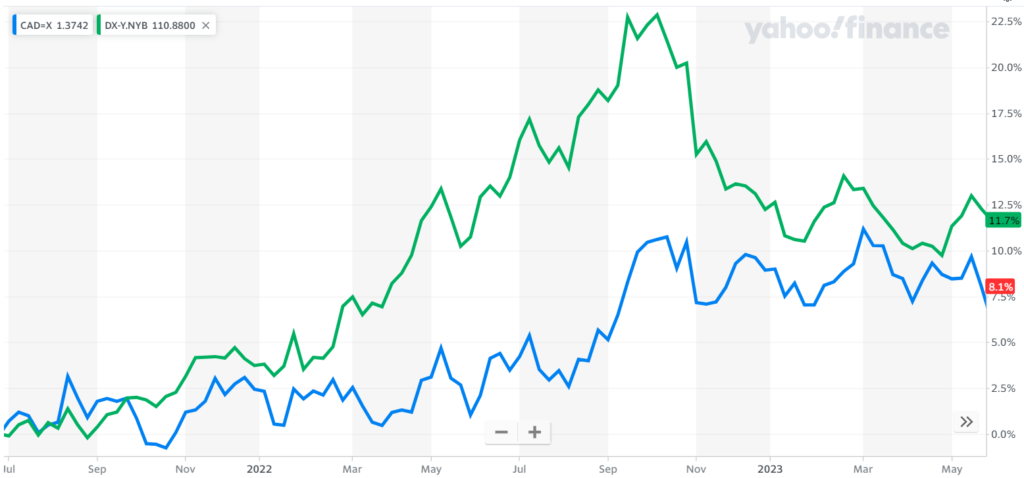
Fig. 2: US Dollar Index (green) and USD vs CAD (blue) – 2 years – Yahoo Finance
The interest rate increases have put strain on various parts of the economy. We never quite know where or when something will break (and usually something does break before the economy cools and central bankers can start lowering rates again.) That breakage typically results to a flight to safe haven currencies, those being the US Dollar, the Japanese Yen, and the Swiss Franc. Hence, I wouldn’t be surprised to see a very brief brief surge up of the safe haven currencies before a gradual decent and (as the other side of the trade) an eventual gradual strengthening of the Canadian Dollar. Not quite yet.
Stock Markets
This spring we have seen a couple of phenomena in the stock markets worth noting. The first phenomenon is that Japan (red line in chart below) and Germany (in green) had the most impressive recoveries recently, with Germany’s market starting from a deep low in October and Japan’s just building steam this year. There are a few macroeconomic factors at play here. In Japan, it is believed that the “Abe-nomics” economic policies of Japan under the former leadership of Shinzo Abe have finally started taking effect, putting Japan back on a growth track. Meanwhile Germany, after having to cope with the struggles of last year’s skyrocketing European natural gas prices, faced an outcome less than the feared worst-case scenario as European gas importers and foreign gas suppliers stepped up to address the extreme gas shortage (or at least the fear of it).
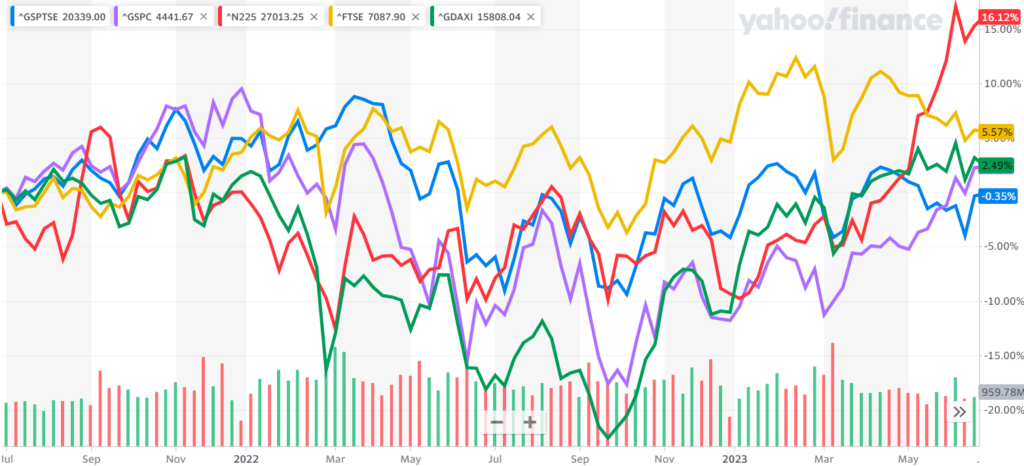
Fig. 3: Equities: US-purple, Can-blue, Jpn-red, UK-yellow, Germany-green – 2 yrs – Yahoo Finance
Note that both Japan and Germany are major capital goods producers. They have strong industries making factory robots, mining equipment, construction equipment, and other industrial equipment with price tags typically north of $1 million. It is surprising to see these two economies do so well at this late stage in the economic cycle. Normally by now capital goods purchases by major corporations would be declining, however a couple of factors are likely keeping capital goods purchases strong. 1) The political hostilities between the USA and China are leading to more “re-shoring” which entails setting up new factories (with the resultant capital goods spending) in more politically-aligned countries. 2) The US government is rolling out the inflation reduction act and infrastructure projects which will help keep capital goods spending strong. To make a long story short, a few atypical factors have contributed to capital goods-dominant economies like Japan and Germany doing better than usual at this point in the business cycle.
The second phenomenon that is quite striking this year is the narrow breadth of the rising stock market. By that I mean a few stocks are rising a lot and most stocks are not. There has been an almost feverish crowding into stocks related to artificial intelligence and related themes by investors. As a result, the S&P500 index, which has roughly 500 major US stocks driving its returns, has been dominated by a small handful of tech stocks. While I don’t doubt there is merit in the belief of the potential that artificial intelligence brings to the table, on the other hand this feels oh so similar to 2000-2001 when the likes of Nortel and JDS Uniphase stock prices were blasting off into space until they totally dominated the stock market index before eventually crashing back to earth. At its peak Nortel represented 45% of the Canadian stock index. Right now a small handful of tech companies are collectively just as dominant of the much larger US index! Right now Nvidia (centre stage of the AI movement) is trading at a price/earnings ratio of about 215. That implies it would take 215 years of current earnings to break even on the purchase price. Of course, Nvidia can grow but can it grow that much? That sounds like a stretch.
Just as a few super star stocks have recently pushed the S&P500 higher, likewise, they will probably pull the average lower at some point too.
As I foreshadowed in the April letter, we responded in the quarter to this market situation by continuing our gradual shift out of equities and towards bonds. In particular we did a fair bit of equity position trimming in May. As a result, I see us now in a much stronger risk-managing stance now. Although “risk managing” usually implies missing some of the upside in the market’s frothy days, it should also help avoid some of the downside, leading to a smoother ride overall. As I have said before we can never precisely predict the market tops and we can’t predict the bottoms either but through focused strategic risk management we can help ensure we have the staying power for the long run.
Respectfully submitted,
Paul Fettes, CFA, CFP, Chief Executive Officer, Brintab Corp.
Leave a Reply